What’s the best sample size for egg break-out?
Tags: Hatchery management | Whitepaper
, 26 July 2018

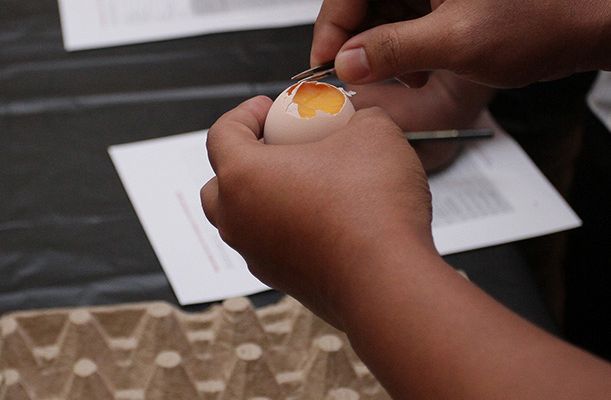
Egg break-outs are often part of the routine of a hatchery. As the procedure for these is time consuming, the findings are usually based on a limited sample size.
Suppose that a hatchery manager wants to test a new incubation program intended to reduce the percentage of externally pipped but not hatched embryos – called dead-in-shell embryos. The eggs are placed on a 150-egg tray and transferred to one hatcher basket after candling. During chick pulling, three hatcher baskets are randomly picked from a hatcher and the number of externally pipped eggs is counted. The sample size in this example would be 450 eggs (150x3). Suppose that the hatchery manager counts a total of 9 dead-in-shell embryos during the break-out, which amounts to 2% of this sample. How sure can one be that this 2% within the sample is a reliable estimator for the whole hatcher?
The table below provides an overview of different sample sizes, showing the prevalence of a certain parameter of interest and the corresponding confidence intervals. Confidence intervals express the accuracy of the average that you obtain from your sample. From the table you can see that using a sample size of three baskets with 2% prevalence of dead-in-shell gives a confidence interval of between 0.9% and 3.8%. If the hatchery manager wants to reduce the dead-in-shells by 1 or 2%, it becomes clear that a confidence interval from 0.9% to 3.8% is quite large in this case. If the sample size is 12 baskets, the interval will be reduced to between 1.4% and 2.8%, which provides a more certain indication that the real average of the whole batch is 2%.
| Sample size | 1% prevalence | 2% prevalence | 5% prevalence |
| 3 baskets | (0.4;2.6) | (0.9;3.8) | (3.3;7.6) |
| 6 baskets | (0.5;1.9) | (1.2;3.1) | (3.7;6.6) |
| 12 baskets | (0.6;1.6) | (1.4;2.8) | (4.0;6.1) |
| 24 baskets | (0.7;1.4) | (1.6;2.5) | (4.3;5.8) |
| 48 baskets | (0.8;1.3) | (1.7;2.4) | (4.5;5.5) |
Table 1. 95% confidence interval (Clopper-Pearson exact method). Calculations are based on 150-egg trays, which are transferred into 150-egg baskets. Homogeneity of samples was assumed, although this is not completely accurate because there is always a certain amount of biological variation.
Of course, before doing the break-out we do not know what the prevalence of the parameter of interest will be. Let’s assume that the worst-case scenario is 5% (which amounts to 7.5 eggs per basket). Define your acceptable level of uncertainty in advance, for example ± 1%. Read in the table above how many baskets you need; in this case it will be 12 baskets as this gives a confidence interval of 4.0-6.1%. If the prevalence turns out to be lower than 5% (for example 1%), then the confidence interval will improve to between 0.6% and 1.6%.
To conclude, the larger your sample size, the more confident you can be that your break-out data reflects reality. Bear in mind that the calculations in the table above are only an approximation of reality. The calculated confidence intervals do not take into account large biological variation for example.
Advice
- If possible increase the number of baskets used for the break-outs. This will increase the value of the data.
- Do not take all the baskets from just one hatcher dolly. If possible, try to sample from the whole hatcher.
Written by Lotte Hebbink
Incubation specialist
I welcome your feedback on this article - and if you require any additional information, please don't hesitate to contact me.