Data analysis: a critical path to improved hatchability
Tags: Hatchery management | Whitepaper
, February 3 2012

In most hatcheries, the routine monitoring of incubation is based on data collected at each stage in the process. This is an important element of specific protocols for quality control and the optimization of hatchery results. For each step in the incubation process, quantifiable criteria have been defined. The hatchability of eggs set is one such quantifiable criterion, defined as the number of saleable chicks hatched from the total number of eggs from a certain batch/flock loaded in one or more incubators.
In most hatcheries, the routine monitoring of incubation is based on data collected at each stage in the process. This is an important element of specific protocols for quality control and the optimization of hatchery results. For each step in the incubation process, quantifiable criteria have been defined. The hatchability of eggs set is one such quantifiable criterion, defined as the number of saleable chicks hatched from the total number of eggs from a certain batch/flock loaded in one or more incubators.
For each age group, hatchability based on eggs set is used to determine an internal standard/reference for that group. The internal standard is a benchmark that allows the evaluation of:
1. overall differences and variation in hatchery results
2. the influence of flock origin on the variation of hatchery results; and
3. the influence of storage on the variation of hatchery results.
This article focuses on variability in the hatchability of eggs from one breed, delivered by different breeder farms to the same hatchery. The ultimate aim is to reduce variability between breeder farms and thereby optimize hatchery results overall.
The hatchability of eggs set is dependent not only on breeder farm management, but also on hatchery-related factors, such as storage conditions or incubation programs. Our analysis is based on data collected over several years, from different flocks incubated at one specific hatchery. With only one breed-type to consider, we can assume that factors related to incubation management are averaged for all flocks and breeder farms throughout the recorded period. We may also therefore assume that in the following example, the main cause of variability is related to breeder farm management, including egg handling at the farm and during transport.
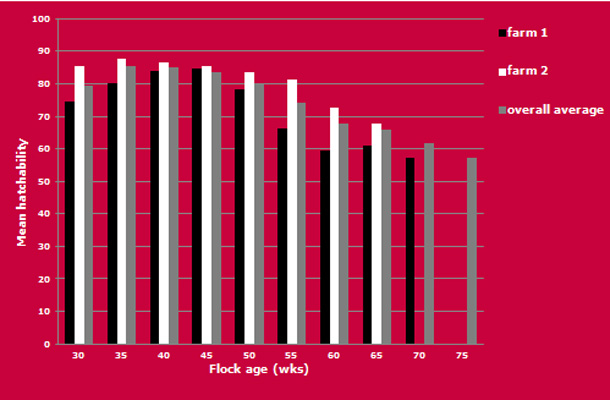
In a comparison of hatchability data from two farmhouses ‘1’ and ‘2’ (figure 1), eggs were received and incubated at a specific hatchery, using standard incubation protocols.
The graph in figure 1 shows that hatchability of eggs produced by farm 1 is below the standard (overall average hatchability), except for flocks aged 41-45 wks. Conversely, the hatchability of eggs received from farm 2 (figure 1), incubated in the same hatchery using the same incubation protocols, deliver above average hatchability (grey bars) for all flock ages.
The results suggest that farm 2 pays greater attention to optimizing breeder farm management and egg handling, both at the farm and during transit. With such attention to these factors, farm 1 could increase its total number of saleable chicks and improve hatchery performance and results overall.
Advice:
- Define a hatchery specific standard based on the average hatchability of eggs set per age group.
- Routinely apply quality control to eggs received from every farm supplying the hatchery.
Compile and use a troubleshooting list.
Reduced hatchability can be expected if eggs received are of poorer quality: poor shell quality and hairline cracks, more dirty eggs, a higher number of floor eggs and eggs placed sharp-end up, for example. - Include candling and break-out procedures (e.g. 10 day candling) as standard. This will routinely identify and/or discount reduced true fertility or increased early mortality as causes of variation in hatchability.
- Communicate the results of your investigations with the breeder farm manager, as an important start to identifying the cause of below average hatchability results.
- Evaluate the effects of modifications to management practice on the hatchability of eggs set.

Fig 1. Percent hatchabilities of eggs (stored less than 8 days) from farm 1 (black bars) and farm 2 (white bars) compared to the overall average (grey bars).